2. 玉林师范学院计算机科学与工程学院, 广西玉林 537000
2. School of Computer Science and Engineering, Yulin Normal University, Yulin, Guangxi, 537000, China
单细胞转录组测序(single-cell RNA-sequencing,scRNA-seq)技术对单个细胞进行测序,可以准确度量每个细胞的基因表达水平,更清晰地反映它们之间的差异[1, 2]。该技术解决了批量细胞(Bulk cell)转录组测序技术对多个细胞测序获得多个细胞的基因表达平均水平时,容易丢失单个细胞独有信息的问题[3, 4]。以scRNA-seq数据为基础,分析细胞异质性[5, 6],刻画基因表达的动态变化[7],对细胞聚类识别细胞类型[8],可以在细胞发育和细胞分化、疾病早期诊断和预后等精准医疗领域发挥重要的作用[9]。例如,阿尔茨海默症[9, 10]、癌症等重大疾病的早期诊断[9, 11],对延长病人存活时间、降低家庭和社会负担具有重要的意义[11, 12]。
当前,scRNA-seq技术发展迅速,可以对数万个单细胞测序,其样本规模从以前的几十至几百个细胞增加到几千至几万个细胞,导致计算复杂度极大增加[13]。此外,scRNA-seq数据呈现高稀疏性[14]、高噪声[15]、高维度[16]、结构信息和位置信息缺乏等特点,对单细胞准确聚类造成了较大的困难。高稀疏指“0”值占比达65%-95%,是极度稀疏的数据。高噪声指单细胞分离时产生低质量细胞、单细胞扩增时覆盖度不均匀,以及低的测序深度可能导致基因低表达,而且不同测序平台、测序协议和参数得到的测序值范围差异较大,这些都会导致大量的技术噪声。高维度指数据维度超过10 000维,难以准确地度量细胞间相似性,并增加计算开销。结构信息和位置信息缺乏指测序时分离了每个细胞,导致细胞间关联等结构信息[17]、细胞的位置信息丢失,从而降低聚类准确性和鲁棒性[6, 18]。当前,单细胞聚类方法包括传统的聚类方法和专门设计的方法[19, 20],主要有k-均值聚类(k-means clustering)和层次聚类(Hierarchical Clustering, HC)等经典聚类方法[21, 22],以及基于映射[23, 24]、基于图划分[25]、基于密度[26, 27]、基于集成的单细胞聚类方法[2]。这些方法在“1.3聚类方法”小节中有具体的描述和分析。
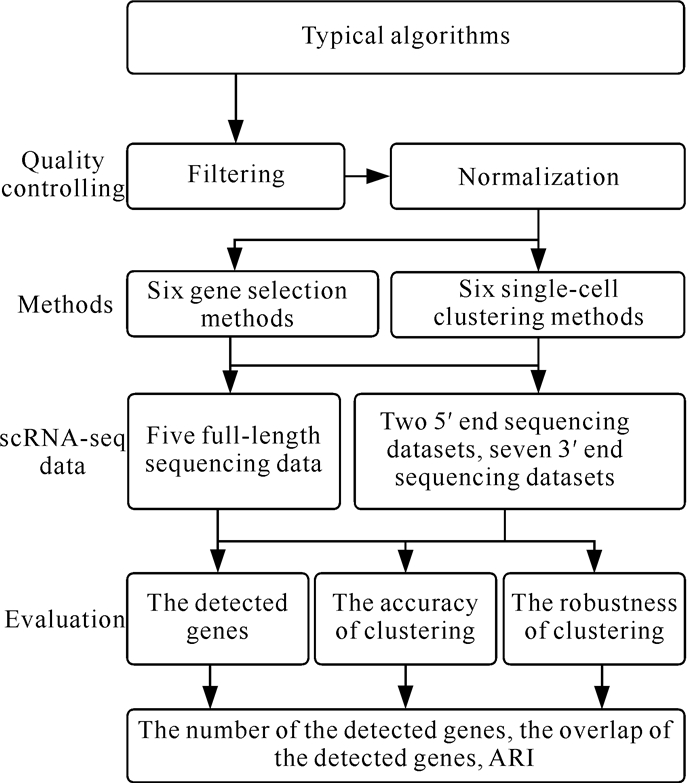
对于不同类型、不同规模的scRNA-seq数据,不同的聚类方法在识别细胞类型时,其性能和结果存在较大差异[28, 29]。因此,为了便于研究者根据数据特点选择合适的聚类方法,准确识别细胞类型[19, 30],本研究分别对采用不同测序协议、数据格式和数据规模的14个scRNA-seq数据集进行分析[31, 32],流程见图 1。其中,测序协议包括全长测序和双端测序;数据格式包括每百万计数(Counts Per Million, CPM)、每百万转录本(Transcripts Per Million, TPM)、每百万转录本的每千碱基片段(Fragments Per Kilobase of Transcript Per Million, FPKM)、每百万映射读长的每千碱基读长(Reads Per Kilobase Per Million Mapped Reads, RPKM)以及原始读长(Reads);数据规模为124-9 519个细胞;稀疏度为64.11%-94.70%[21, 33]。本研究将分析比较6种代表性基因选择方法选择高差异表达基因的情况,以及6种单细胞聚类方法的聚类准确性和鲁棒性。

|
| 图 1 scRNA-seq数据聚类分析流程 Fig. 1 Clustering analysis flow chart of scRNA-seq data |
1 方法比较 1.1 质量控制
对scRNA-seq数据进行质量控制,既可以降低数据维度,又可以去除噪声,从而提高单细胞聚类的性能[5, 34]。质量控制主要包括两个步骤:过滤和归一化。(1)过滤。通过设置阈值,过滤低质量的细胞和基因。例如,设置某细胞中表达基因数阈值,过滤多细胞、死细胞等低质量细胞;设置某基因表达的细胞数阈值,过滤低表达基因或稀有基因。(2)归一化。通过使用归一化因子或对数转换对基因表达量进行归一化,可以消除scRNA-seq数据的拖尾现象。表 1列出了6种典型的基因选择方法的质量控制分析。
| 基因选择方法 Gene selection methods |
过滤Filtering | 归一化 Normalization |
|
| 细胞Cell | 基因Gene | ||
| Seurat | Delete the cells with expressed genes more than 2 000 or less than 200, and filter the cells with mitochondrial genes more than 5% | Delete the genes with 0 expression in all cells | size.factors=total counts per cell/10000, log (counts)/size.factors+1 |
| Scran | Delete the cells with too low counts or too high spike-in | Delete the genes with 0 expression in all cells | preclusters=quickCluster (counts), size.factors=computeSumFactors (counts, clusters=preclusters), log (counts)/size.factors+1 |
| Monocle | Delete the cells with expressed genes more than 2 000 or less than 200, and filter the cells with mitochondrial genes more than 5% | Delete the genes expressed in less than 10 cells | size.factors=total counts per cell/10000;log (counts)/size.factors+1 |
| Brennecke | Delete the cells with total counts below three times Median Absolute Deviations (MADs) in all cells | Delete the genes with 0 expression in all cells | size.factors=total counts per cell/he mean of total counts in all cells; log (counts)/size.factors+1 |
| M3Drop | Delete the cells with expressed genes less than 2 000 | Delete the genes with 0 expression in cells or with mean value less than 0.05 | size.factors=total counts per cell/the mean of total counts in all cells; counts/size.factors |
| NBDropFS | Delete the cells with expressed genes less than 2 000 | Delete the genes with 0 expression in cells or with mean value less than 0.05 | size.factors=total counts per cell/the mean of total counts in all cells; counts/size.factors |
从表 1可以看出,6种基因选择方法在质量控制的过滤和归一化中分别设置了不同的阈值参数。例如,过滤包含表达基因数少的低质量细胞时,阈值参数分别设为非0表达基因数、基因表达量总和,以及线粒体基因的占比;过滤在所有细胞中低表达的稀有基因时,阈值参数分别设为表达的细胞数和基因表达量总和。为了过滤低质量细胞,细胞中非0表达基因数的阈值设置为200或2 000,细胞中基因表达计数总和阈值设置为3倍的绝对偏差中位数(Median Absolute Deviations, MADs)。为了过滤稀有基因,非0表达的细胞数阈值设置为10,基因表达均值阈值设置为0.05。使用size.factors因子和对数变换进行归一化,size.factors因子的值分别取决于基因表达总计数均值,或总计数的中位数,或常数10 000;对数转换消除了在scRNA-seq数据中经常出现的拖尾现象。
1.2 基因选择scRNA-seq数据在大于10 000的维度中,实际上只有2 000-3 000个基因对单细胞聚类有作用[35]。因此,使用特征选择方法过滤对聚类作用不大的大部分基因,可以同时去除噪声和降低计算复杂度。特征选择方法是从高维特征中选择一组具有统计意义的原始特征的方法,降维后的特征仍然是原始特征,没有引入新的噪声,因此该方法越来越受到关注。但是,特征选择方法存在如何设计合适的选择策略,以发现具有实际意义特征子集的问题。
scRNA-seq数据的基因选择策略主要有3种类型。(1)基于高表达的基因选择(High Mean Gene, HMG)。该策略通过设置阈值,删除基因表达量均值低于阈值的基因来筛选出基因表达量均值高的基因。比如,Duò等[31]通过设置阈值为10%,筛选出基因表达量均值前10%的基因。(2)基于高差异表达的基因选择(High Variable Gene, HVG)。该策略通过量化每个基因在所有细胞中基因表达水平的差异度,筛选出高差异表达的基因。例如,Satija等[36]通过计算基因表达量的均值和离散度,量化基因表达水平差异,选择高差异表达的基因。(3)基于基因表达分布的基因选择(Drop-out based method)。该策略通过设计统计模型描述基因表达分布,并根据分布特性选择基因。表 2列出了6个经典的基因选择方法,并从模型因子、测序平台、方法局限性和优势等方面进行对比分析。从表 2可以看出,大多数基因选择方法中,均值是重要的模型因子,说明高表达基因在聚类中起着至关重要的作用。此外,少量或大量的基因识别数会影响聚类的性能。
| 基因选择方法 Gene selection methods |
类型 Types |
模型因子 Model factors |
测序平台 Sequence platforms |
方法局限性 Limitation of methods |
优势 Advantages |
| Seurat | HVG | Dispersion | Full length sequencing; UMI | Identify a few number of genes | Lower time complexity; suitable for different datasets |
| Scran | HVG | Mean; variance | UMI | Identify a large number of genes | Higher robustness |
| Monocle | HVG | Mean | UMI | Poorer robustness | Lower time complexity; suitable for large scale datasets |
| Brennecke | HMG | Mean | Full length sequencing; UMI | Identify a few number of genes | Lower time complexity; suitable for different datasets and large scale datasets |
| M3Drop | Drop-out based method | Mean; dropout rate |
Full length sequencing | Higher time complexity Poorer stability |
Higher robustness; suitable for high-noisy datasets |
| NBDropFS | Drop-out based method | Mean; dropout rate |
UMI | Sensitive to preprocessing; higher time complexity | Higher sequencing efficiency |
1.3 聚类方法
scRNA-seq数据缺乏细胞类型标签和类别数等先验知识,因此,无监督学习的聚类方法是识别细胞类型的重要方法。单细胞聚类方法包含传统的聚类方法和专门的聚类方法。
(1) 传统的聚类方法
k均值聚类。Macosko等[21]通过使用k均值方法对基因进行聚类,识别具有相似表达的基因子集,在此基础上对细胞周期进行评分排序,根据评分实现单细胞聚类。Shin等[22]使用皮尔逊相关系数计算细胞间的相似性,采用最小生成树连接k个聚类中心得到细胞的发育轨迹,使用k均值聚类方法实现单细胞聚类。
层次聚类[37]。Llorens-Bobadilla等[32]使用欧氏距离计算细胞之间的距离,通过重采样估算类别数,采用层次聚类方法实现单细胞聚类。Darmanis等[38]使用皮尔逊相关系数计算细胞之间的相似性,使用层次聚类方法对单细胞聚类。
(2) 基于映射的单细胞聚类方法
SHARP使用“分而治之”策略,将大规模数据分割成块[23]。使用稀疏随机投影(Random Projection, RP)算法,基于随机矩阵R将原始的D维数据映射为d维数据。随机矩阵R中的元素定义为D1/4乘以1(或0、-1),降维后的维数d定义为d=log2(N)/ε2[ε∈(0, 1)]。运行k次RP算法得到k个d维矩阵,计算对应的k个相似性矩阵,在每个相似性矩阵上运行层次聚类,得到k个聚类结果。通过加权wMetaC方法集成这k个聚类结果,得到最终的聚类结果。
scDeepCluster融合零膨胀负二项(Zero Inflation Negative Binomial,ZINB)模型和自编码器,实现非线性函数映射并学习低维嵌入表示[24]。在自编码器中,引入随机高斯噪声以增强低维表示;在解码器中构建3个全连接层分别估计均值、离散度和缺失率对应的ZINB损失。使用Kullback-Leibler(KL)散度度量输入数据和重构数据间的分布差异,并构建新的损失函数。在输出的低维空间使用k-means进行聚类。
(3) 基于图划分的单细胞聚类方法
Monocle 3使用统一流形逼近和投影(Uniform Manifold Approximation and Projection,UMAP)将scRNA-seq数据映射到低维空间,在此低维空间中使用Louvain社区检测算法实现图划分,对单细胞聚类,将相邻的细胞类合并为“超级类”[39]。最后,推断单个细胞在发育过程中的路径或轨迹,识别每个超级类的分支和合并位置。
(4) 基于密度的单细胞聚类方法
SIMLR假设存在C个细胞类,那么细胞间的相似性矩阵应该具有C个近似的对角性块状结构,通过构造加权的高斯核函数,学习多个高斯核函数的权重[26]。定义细胞间的距离,从不同角度度量细胞间距离,构建对称的相似性矩阵S。同时,对相似性矩阵S、S上低秩约束的辅助低维矩阵L和权重ω进行优化学习。对学习得到的相似性矩阵直接使用亲和传播(Affinity Propagation,AP)算法聚类,或在降维后的低维空间使用k-means进行聚类。
Seurat集成了scRNA-seq数据和原位杂交空间转录组数据,通过识别高差异表达基因子集,学习标记基因的表达模型,去除标记基因表达的随机噪声[27]。通过将scRNA-seq数据估计的双峰表达模型与二值化的空间转录组数据对齐,建立基因表达统计模型,推断单细胞的空间位置。构建细胞共享近邻(Shared Nearest Neighbor, SNN)图,在共享近邻图中使用k-means对细胞聚类。
(5) 基于集成的单细胞聚类方法
SC3分别用欧氏距离、Pearson相关系数、Spearman相关系数度量细胞间的距离[2]。利用主成分分析得到前d个主成分,在d个相似性矩阵中使用k-means聚类。根据节点对出现在同一类中的概率,将d个聚类结果集成到一个共识矩阵中,最后使用层次聚类对细胞聚类。
代表性的单细胞聚类方法及其特点对比分析见表 3。从表 3可以看出,基于映射的聚类方法将高维的scRNA-seq数据映射到低维空间,降低计算复杂度,可扩展性好,适用于大规模scRNA-seq数据,但是存在需要大内存的局限性。基于图划分、基于密度和基于集成的聚类方法,聚类准确性好,但存在计算复杂度高的局限性,适用于小规模scRNA-seq数据。
| 单细胞聚类方法 Single-cell clustering methods |
类型 Types |
数据规模 Data size |
方法局限性 Limitation of methods |
优势 Advantages |
| SHARP | Map-based | 124-1 000 000 | Larger memory | Higher scalability, higher accuracy and robustness |
| scDeepCluster | Map-based | 4 271, 2 717, 2 746, 4 186 |
Larger memory | Higher scalability |
| Monocle 3 | Graph division-based | >1 000 | Higher time complexity, poorer scalability | Higher accuracy, trajectory inference |
| SIMLR | Density-based | <1 000 | Higher time complexity, poorer scalability | Higher accuracy |
| Seurat | Density-based | 851 | Higher time complexity, poorer scalability | Higher accuracy and robustness, spatial position recognition |
| SC3 | Ensemble-based | 49-3 005 | Higher time complexity, poorer scalability | Higher accuracy, automatically estimate the number of clusters k |
2 实验与结果分析
为了深入探讨不同方法对scRNA-seq数据分析的性能差异,本研究收集了14个scRNA-seq数据集,分别对6种基因选择方法在识别基因数、基因重叠度等方面进行对比分析。此外,在使用不同基因选择方法的基础上,分别对6种单细胞聚类方法的聚类准确性和稳定性等方面进行对比分析。
2.1 数据集从基因表达综合数据库(GEO, https://www.ncbi.nlm.nih.gov/geo/)和欧洲生物信息学研究所网站(EMBL-EBI, https://www.ebi.ac.uk/)下载14个带有真实标签的金标准scRNA-seq数据集,包括5个全长测序数据集和9个双端测序数据集(表 4)。这些数据集分别具有不同的测序协议、数据规模和稀疏度,其中5个数据集包含的细胞数大于3 000。这些数据集使用的Smart-seq2、10×genomics、Drop-seq等测序协议具有不同的特点:(1)与10×genomics相比,Smart-seq2具有更高的敏感度,可以检测到更多的基因,但其测序数据呈单峰分布,检测到的低表达基因少; (2)10×genomics数据呈双峰分布,可以检测到大量的0表达,这可能导致有更多的缺失(Dropout)事件, 但它可以测序更多的细胞,更有效地检测罕见的细胞类型; (3)Drop-seq捕获效率较低,成本低,速度更快,不适合小样本测序。
| 标识号ID | 数据集 Datasets |
测序协议 Sequencing protocol |
类别数 Number of categories |
细胞数 Number of cells |
基因数 Number of gene |
稀疏度/% Sparsity/% |
参考文献 Reference |
| GSE94333 | Adam | Drop-seq | 8 | 3 660 | 23 797 | 92.33 | [40] |
| GSE84133 | Baron2016_m | InDrop | 13 | 1 886 | 14 878 | 88.97 | [41] |
| E-MTAB-3321 | Goolam2016 | Smart-seq2 | 4 | 124 | 41 480 | 68.55 | [42] |
| GSE65525 | Klein2015 | InDrop | 4 | 2 717 | 24 175 | 65.76 | [43] |
| GSE81861 | Li2017 | SMARTer | 9 | 561 | 55 186 | 78.52 | [44] |
| GSE67835 | Muraro | CEL-seq2 | 9 | 2 122 | 19 046 | 73.02 | [38] |
| GSE63473 | Plasschaert | InDrop | 8 | 6 977 | 28 205 | 92.57 | [45] |
| E-MTAB-2805 | Pollen | SMARTer | 11 | 301 | 21 721 | 64.11 | [46] |
| GSE74672 | Romanov2016 | Fluidigm C1 | 7 | 2 881 | 24 341 | 87.77 | [47] |
| GSE71585 | Tasic2016 | SMARTer | 17 | 1 679 | 24 150 | 68.30 | [48] |
| GSE109488 | Wang_Kidney | STRT-seq | 12 | 2 714 | 22 329 | 80.89 | [49] |
| GSE106960 | Wang_Lung | 10×genomics | 2 | 9 519 | 14 561 | 85.30 | [50] |
| PMC6104812 | Young | 10×genomics | 11 | 5 685 | 33 658 | 94.70 | [51] |
| GSE60361 | Zeisel2015 | STRT | 7 | 3 005 | 19 972 | 81.21 | [52] |
2.2 不同基因选择方法检测基因的对比分析
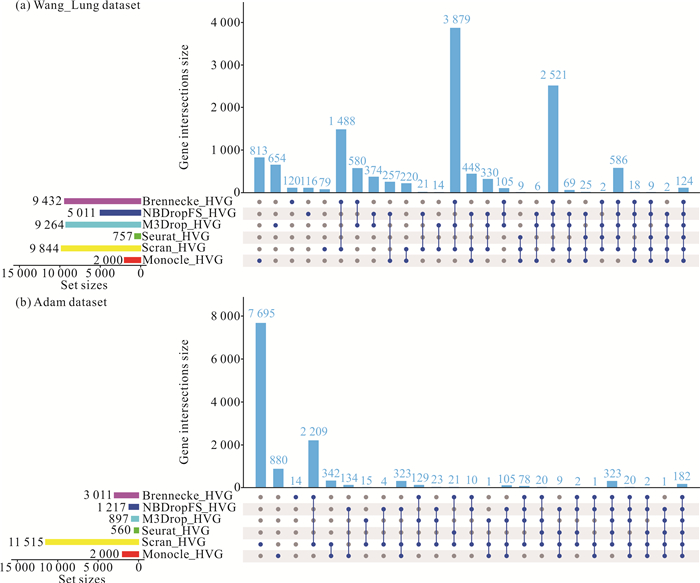
为了观察不同基因选择方法选择基因的情况,使用6种基因选择方法分别在Wang_Lung、Adam数据集上检测基因。图 2和图 3分别是所检测基因的基因数、基因重叠度的upset图和韦恩图。在upset图中,横坐标是基因选择方法,包括检测到独有基因的基因选择方法,以及检测到共有基因的基因选择方法组合(这些基因选择方法由竖线相连),纵坐标是检测的基因数,其下方左侧是每个基因选择方法经过质量控制后留下的基因数。

|
| 图 2 6种基因选择方法检测基因的upset图 Fig. 2 Upset plots of genes detected by 6 gene selection methods |

|
| 图 3 6种基因选择方法所检测基因的韦恩图 Fig. 3 Venn diagram of genes detected by 6 gene selection methods |
从图 2和图 3可以看出,在Wang_Lung数据集中,除了Seurat方法以外,其他5种方法都检测到独有基因,Brennecke检测到120个独有基因,NBDropFS检测到116个独有基因,M3Drop检测到654个独有基因,Scran检测到79个独有基因,Monocle检测到813个独有基因,6种方法检测到124个共有基因。在Adam数据集中,Seurat过滤了绝大部分基因,仅保留了560个基因;Scran过滤了少部分基因,保留了11 515个基因。Scran检测到7 695个独有基因,Monocle检测到880个独有基因,Brennecke检测到14个独有基因,每种方法都与其他5种基因选择方法检测的基因有重叠度,6种方法检测到182个共有基因。Brennecke和Scran在两个数据集中检测的共有基因数分别是1 488和2 209,可以看出,这两种方法检测的基因重叠度比较大。Monocle与其他5种方法检测的基因重叠度相对比较小。
2.3 不同基因选择方法对单细胞聚类性能的影响为了观察不同基因选择方法检测的基因对不同单细胞聚类方法的性能影响,分别对6种基因选择方法检测到的基因使用6种聚类方法进行单细胞聚类,采用调整的兰德指数(Adjusted Rand Index, ARI)[53]评价聚类性能。ARI度量了在预测类和真实类中都处在相同类的节点对的数量,其值的范围是-1到1。当ARI达到最大值1时,表示预测的类与真实类一致。
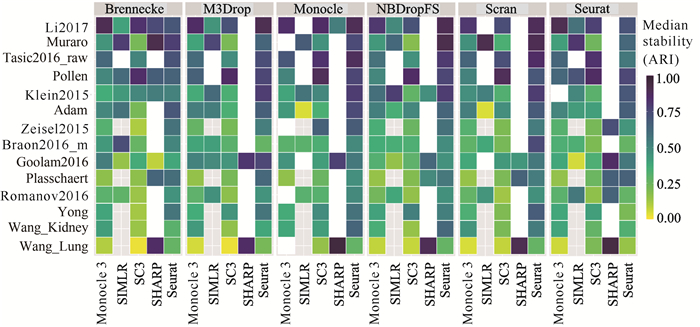
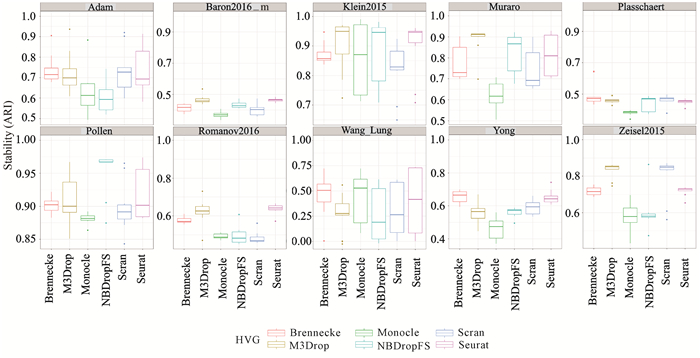
绘制ARI均值热图、ARI箱形图,以便更深入地观察和分析聚类性能的差异。融合6种基因选择方法和6种单细胞聚类方法,运行100次,其中5种单细胞聚类方法聚类结果的ARI均值见图 4,聚类结果的ARI值箱形图见图 5;此外,第6种单细胞聚类方法scDeepCluster取10个不同的随机种子,聚类结果的ARI箱形图见图 6。实验中,Monocle分别采用了tSNE和UMAP降维,Seurat分别采用了PCA和ICA降维,其他方法没有进行降维。Monocle 3分别采用了densityPeak和Louvain对单细胞聚类,其他方法则分别采用自带的聚类方法。

|
| 图 4 结合6种基因选择方法和5种单细胞聚类方法聚类结果的ARI均值 Fig. 4 Mean of ARI of 5 single-cell clustering methods combining with 6 gene selection methods |

|
| 图 5 结合6种基因选择方法和5种单细胞聚类方法聚类结果的ARI箱形图 Fig. 5 Box plot of ARI of 5 single-cell clustering methods combining with 6 gene selection methods |

|
| 图 6 结合6种基因选择方法,scDeepCluster聚类结果的ARI箱形图 Fig. 6 ARI box plot of scDeepCluster clustering results combined with 6 gene selection methods |
从图 4和图 5可以看出,Seurat、SC3和Monocle 3结合不同的基因选择方法时,聚类性能ARI的稳定性更好;SHARP和SIMLR结合不同的基因选择方法时,聚类性能ARI的差异相对比较大。从图 5可以看出,结合不同的基因选择方法,Seurat在所有数据集上的聚类稳定性和准确性最好,SC3次之,Monocle 3也比较好。此外,在Plasschaert、Wang_Kidney、Wang_Lung、Yong和Zeisel2015等5个数据集中,由于相似性计算的开销大,SIMIR方法没有实验结果。从图 6可以看出,scDeepCluster结合不同的基因选择方法时,在所有数据集上也表现出比较好的稳定性,在大部分数据集上表现出很好的聚类性能。
3 讨论为给研究者在选择合适的方法分析scRNA-seq数据时提供借鉴,本研究对比分析了scRNA-seq数据当前典型的质量控制、基因选择和聚类等方法。在对比分析质量控制时,发现通过设置不同的阈值,可以过滤低质量细胞和稀有基因,并且采用对数转换归一化可以消除数据拖尾现象。在对比分析基因选择时,通过比较6种典型的基因选择方法,发现均值是检测基因的重要模型因子,除Seurat以外的5种基因选择方法都使用了均值建模。此外,从实验结果可以看出,不同方法检测到一些相同的共有基因和少量的独有基因。6种基因选择方法在Adam和Wang_Lung数据集分别可以检测到182个和124个共有基因,Scran、Monocle、Brennecke、NBDropFS和M3Drop都检测到独有基因,Seurat则未检测到。检测到的共有基因包含了识别细胞类型的重要信息,检测到的独有基因反映了该方法建模条件下识别细胞类型的重要信息。在检测到的共有基因和独有基因的基础上,可以进一步分析它们在细胞发育过程轨迹推断中的作用。不同方法检测到的基因数有比较大的差异,Seurat检测到的基因数最少(<1 000),而Scran检测到的基因数最多(10 000左右)。在对比分析聚类时,结合6种不同基因选择方法,对6种单细胞聚类方法进行聚类性能比较,发现Seurat、SC3、Monocle 3和scDeepCluster的聚类稳定性较好,而SHARP和SIMLR的聚类稳定性则相对较差;Seurat在所有数据集上的聚类稳定性和准确性最好,scDeepCluster在大部分数据集上有很好的聚类准确性。因此,选择合适的scRNA-seq数据分析方法,需要综合考虑测序平台、数据规模,以及基因表达分布等因素。
随着第三代测序技术的迅速发展,产生了空间转录组(Spatial Transcriptome, ST)测序数据、单细胞基因组测序(single cell DNA sequencing, scDNA-seq)数据、单细胞甲基化测序(single cell methylation sequencing, sc-methyl-seq)数据等多种组学的测序数据,研究不同组学测序数据的对齐方法,有效融合多组学测序数据的重要信息,实现信息对齐和互补,有助于更准确地识别细胞类型。另外,当前的scRNA-seq数据具有长读长、大规模的新特点,长读长scRNA-seq数据存在更多的噪声,大规模scRNA-seq数据会导致更大的内存需求和计算时间开销问题,进一步研究基于数据分布的有效去噪方法、适合大规模数据的图神经网络降维方法,以提高数据质量并准确度量细胞间相似性,在细胞类型识别时加强生物可解释性,提升细胞类型识别和下游分析的性能等都是以后的重要工作。
| [1] |
MA Q, XU D. Deep learning shapes single-cell data analysis[J]. Nature Reviews Molecular Cell Biology, 2022, 23(5): 303-304. DOI:10.1038/s41580-022-00466-x |
| [2] |
BUTEREZ D, BICA I, TARIQ I, et al. CellVGAE: an unsupervised scRNA-seq analysis workflow with graph attention networks[J]. Bioinformatics, 2022, 38(5): 1277-1286. DOI:10.1093/bioinformatics/btab804 |
| [3] |
GAWAD C, KOH W, QUAKE S R. Single-cell genome sequencing: current state of the science[J]. Nature Reviews Genetics, 2016, 17(3): 175-188. DOI:10.1038/nrg.2015.16 |
| [4] |
PAN X T, LI Z, QIN S W, et al. ScLRTC: imputation for single-cell RNA-seq data via low-rank tensor completion[J]. BMC Genomics, 2021, 22(1): 860. DOI:10.1186/s12864-021-08101-3 |
| [5] |
WANG Z W, DING H, ZOU Q. Identifying cell types to interpret scRNA-seq data: how, why and more possibilities[J]. Briefings in Functional Genomics, 2020, 19(4): 286-291. DOI:10.1093/bfgp/elaa003 |
| [6] |
BLENCOWE M, ARNESON D, DING J, et al. Network modeling of single-cell omics data: challenges, opportunities, and progresses[J]. Emerging Topics in Life Sciences, 2019, 3(4): 379-398. DOI:10.1042/ETLS20180176 |
| [7] |
SAELENS W, CANNOODT R, TODOROV H, et al. A comparison of single-cell trajectory inference methods[J]. Nature Biotechnology, 2019, 37(5): 547-554. DOI:10.1038/s41587-019-0071-9 |
| [8] |
KISELEV V Y, ANDREWS T S, HEMBERG M. Challenges in unsupervised clustering of single-cell RNA-seq data[J]. Nature Reviews Genetics, 2019, 20(5): 273-282. DOI:10.1038/s41576-018-0088-9 |
| [9] |
JIANG J, WANG C K, QI R, et al. scREAD: a single-cell RNA-seq database for Alzheimer's disease[J]. IScience, 2020, 23(11): 101769. DOI:10.1016/j.isci.2020.101769 |
| [10] |
VAN BUREN E, HU M, CHENG L, et al. TWO-SIGMA-G: a new competitive gene set testing framework for scRNA-seq data accounting for inter-gene and cell-cell correlation[J]. Briefings in Bioinformatics, 2022, 23(3): bbac084. DOI:10.1093/bib/bbac084 |
| [11] |
LI J, KLUGHAMMER J, FARLIK M, et al. Single-cell transcriptomes reveal characteristic features of human pancreatic islet cell types[J]. EMBO Reports, 2016, 17(2): 178-187. DOI:10.15252/embr.201540946 |
| [12] |
REHMAN A U, RASHID A, ANWAR I. Single cell RNA Sequencing (scRNA-Seq) as an emerging technology in cancer research[J]. Proceedings of the Pakistan Academy of Sciences: B.Life and Environmental Sciences, 2021, 58(3): 19-28. |
| [13] |
PETEGROSSO R, LI Z L, KUANG R. Machine learning and statistical methods for clustering single-cell RNA-sequencing data[J]. Briefings in Bioinformatics, 2020, 21(4): 1209-1223. DOI:10.1093/bib/bbz063 |
| [14] |
HU J, LI X J, HU G, et al. Iterative transfer learning with neural network for clustering and cell type classification in single-cell RNA-seq analysis[J]. Nature Machine Intelligence, 2020, 2(10): 607-618. DOI:10.1038/s42256-020-00233-7 |
| [15] |
HUANG M, WANG J S, TORRE E, et al. SAVER: gene expression recovery for single-cell RNA sequencing[J]. Nature Methods, 2018, 15(7): 539-542. DOI:10.1038/s41592-018-0033-z |
| [16] |
PENG L H, TIAN X F, TIAN G, et al. Single-cell RNA-seq clustering: datasets, models, and algorithms[J]. RNA Biology, 2020, 17(6): 765-783. DOI:10.1080/15476286.2020.1728961 |
| [17] |
BHARDWAJ N, LU H. Correlation between gene expression profiles and protein-protein interactions within and across genomes[J]. Bioinformatics, 2005, 21(11): 2730-2738. DOI:10.1093/bioinformatics/bti398 |
| [18] |
SUN X B, LIN X C, LI Z Y, et al. A comprehensive comparison of supervised and unsupervised methods for cell type identification in single-cell RNA-seq[J]. Briefings in Bioinformatics, 2022, 23(2): bbab567. DOI:10.1093/bib/bbab567 |
| [19] |
ZHAO Q C, ZHANG T, YANG H. ScRNA-seq identified the metabolic reprogramming of human colonic immune cells in different locations and disease states[J]. Biochemical and Biophysical Research Communications, 2022, 604: 96-103. DOI:10.1016/j.bbrc.2022.03.034 |
| [20] |
YUAN Y, BAR-JOSEPH Z. Deep learning of gene relationships from single cell time-course expression data[J]. Briefings in Bioinformatics, 2021, 22(5): bbab142. DOI:10.1093/bib/bbab142 |
| [21] |
MACOSKO E Z, BASU A, SATIJA R, et al. Highly parallel genome-wide expression profiling of individual cells using nanoliter droplets[J]. Cell, 2015, 161(5): 1202-1214. DOI:10.1016/j.cell.2015.05.002 |
| [22] |
SHIN J, BERG D A, ZHU Y H, et al. Single-cell RNA-seq with waterfall reveals molecular cascades underlying adult neurogenesis[J]. Cell Stem Cell, 2015, 17(3): 360-372. DOI:10.1016/j.stem.2015.07.013 |
| [23] |
WAN S B, KIM J, WON K J. SHARP: hyperfast and accurate processing of single-cell RNA-seq data via ensemble random projection[J]. Genome Research, 2020, 30(2): 205-213. DOI:10.1101/gr.254557.119 |
| [24] |
TIAN T, WAN J, SONG Q, et al. Clustering single-cell RNA-seq data with a model-based deep learning approach[J]. Nature Machine Intelligence, 2019, 1(4): 191-198. DOI:10.1038/s42256-019-0037-0 |
| [25] |
JIA C, HU Y, KELLY D, et al. Accounting for technical noise in differential expression analysis of single-cell RNA sequencing data[J]. Nucleic Acids Research, 2017, 45(19): 10978-10988. DOI:10.1093/nar/gkx754 |
| [26] |
WANG B, RAMAZZOTT D, DE SANO L, et al. SIMLR: a tool for large-scale genomic analyses by multi-kernel learning[J]. Proteomics, 2018, 18(2): 1700232. DOI:10.1002/pmic.201700232 |
| [27] |
HAO Y H, HAO S, ANDERSEN-NISSEN E, et al. Integrated analysis of multimodal single-cell data[J]. Cell, 2021, 184(13): 3573-3587. DOI:10.1016/j.cell.2021.04.048 |
| [28] |
CHU L F, LENG N, ZHANG J, et al. Single-cell RNA-seq reveals novel regulators of human embryonic stem cell differentiation to definitive endoderm[J]. Genome Biology, 2016, 17(1): 173. DOI:10.1186/s13059-016-1033-x |
| [29] |
XU L, XUE T, DING W Y, et al. Comparison of scRNA-seq data analysis method combinations[J]. Briefings in Functional Genomics, 2022, 21(6): 433-440. DOI:10.1093/bfgp/elac027 |
| [30] |
PHIPSON B, SIM C B, PORRELLO E R, et al. Propeller: testing for differences in cell type proportions in single cell data[J]. Bioinformatics, 2022, 38(20): 4720-4726. DOI:10.1093/bioinformatics/btac582 |
| [31] |
DUÒ A, ROBINSON M D, SONESON C. A systematic performance evaluation of clustering methods for single-cell RNA-seq data[J]. F1000 Research, 2018, 7: 1141. DOI:10.12688/f1000research.15666.2 |
| [32] |
LLORENS-BOBADILLA E, ZHAO S, BASER A, et al. Single-cell transcriptomics reveals a population of dormant neural stem cells that become activated upon brain injury[J]. Cell Stem Cell, 2015, 17(3): 329-340. DOI:10.1016/j.stem.2015.07.002 |
| [33] |
FRASER H B, HIRSH A E, WALL D P, et al. Coevolution of gene expression among interacting proteins[J]. Proceedings of the National Academy of Sciences of the United States of America, 2004, 101(24): 9033-9038. |
| [34] |
KHARCHENKO P V. The triumphs and limitations of computational methods for scRNA-seq[J]. Nature Methods, 2021, 18(7): 723-732. DOI:10.1038/s41592-021-01171-x |
| [35] |
ADOSSA N A, RYTKÖNEN K T, ELO L L. Dirichlet process mixture models for single-cell RNA-seq clustering[J]. Biology Open, 2022, 11(4): bio059001. DOI:10.1242/bio.059001 |
| [36] |
SATIJA R, FARRELL J A, GENNERT D, et al. Spatial reconstruction of single-cell gene expression data[J]. Nature Biotechnology, 2015, 33(5): 495-502. DOI:10.1038/nbt.3192 |
| [37] |
DASGUPTA S, LONG P M. Performance guarantees for hierarchical clustering[J]. Journal of Computer and System Sciences, 2005, 70(4): 555-569. DOI:10.1016/j.jcss.2004.10.006 |
| [38] |
DARMANIS S, SLOAN S A, ZHANG Y, et al. A survey of human brain transcriptome diversity at the single cell level[J]. Proceedings of the National Academy of Sciences of the United States of America, 2015, 112(23): 7285-7290. |
| [39] |
CAO J Y, SPIELMANN M, QIU X J, et al. The single-cell transcriptional landscape of mammalian organogenesis[J]. Nature, 2019, 566(7745): 496-502. DOI:10.1038/s41586-019-0969-x |
| [40] |
ADAM M, POTTER A S, POTTER S S. Psychrophilic proteases dramatically reduce single-cell RNA-seq artifacts: a molecular atlas of kidney development[J]. Development, 2017, 144(19): 3625-3632. |
| [41] |
BARON M, VERES A, WOLOCK S L, et al. A single-cell transcriptomic map of the human and mouse pancreas reveals inter-and intra-cell population structure[J]. Cell Systems, 2016, 3(4): 346-360. e4. DOI:10.1016/j.cels.2016.08.011 |
| [42] |
GOOLAM M, SCIALDONE A, GRAHAM S J L, et al. Heterogeneity in Oct4 and Sox2 targets biases cell fate in 4-cell mouse embryos[J]. Cell, 2016, 165(1): 61-74. DOI:10.1016/j.cell.2016.01.047 |
| [43] |
KLEIN A M, MAZUTIS L, AKARTUNA I, et al. Droplet barcoding for single-cell transcriptomics applied to embryonic stem cells[J]. Cell, 2015, 161(5): 1187-1201. DOI:10.1016/j.cell.2015.04.044 |
| [44] |
LI H P, COURTOIS E T, SENGUPTA D, et al. Reference component analysis of single-cell transcriptomes elucidates cellular heterogeneity in human colorectal tumors[J]. Nature Genetics, 2017, 49(5): 708-718. DOI:10.1038/ng.3818 |
| [45] |
PLASSCHAERT L W, ŽILIONIS R, CHOO-WING R, et al. A single-cell atlas of the airway epithelium reveals the CFTR-rich pulmonary ionocyte[J]. Nature, 2018, 560(7718): 377-381. DOI:10.1038/s41586-018-0394-6 |
| [46] |
POLLEN A A, NOWAKOWSKI T J, SHUGA J, et al. Low-coverage single-cell mRNA sequencing reveals cellular heterogeneity and activated signaling pathways in developing cerebral cortex[J]. Nature Biotechnology, 2014, 32(10): 1053-1058. DOI:10.1038/nbt.2967 |
| [47] |
ROMANOV R A, ZEISEL A, BAKKER J, et al. Molecular interrogation of hypothalamic organization reveals distinct dopamine neuronal subtypes[J]. Nature Neuroscience, 2017, 20(2): 176-188. DOI:10.1038/nn.4462 |
| [48] |
TASIC B, MENON V, NGUYEN T N, et al. Adult mouse cortical cell taxonomy revealed by single cell transcriptomics[J]. Nature Neuroscience, 2016, 19(2): 335-346. DOI:10.1038/nn.4216 |
| [49] |
WANG P, CHEN Y D, YONG J, et al. Dissecting the global dynamic molecular profiles of human fetal kidney development by single-cell RNA sequencing[J]. Cell Reports, 2018, 24(13): 3554-3567. DOI:10.1016/j.celrep.2018.08.056 |
| [50] |
WANG Y J, TANG Z, HUANG H W, et al. Pulmonary alveolar type Ⅰ cell population consists of two distinct subtypes that differ in cell fate[J]. Proceedings of the National Academy of Sciences of the United States of America, 2018, 115(10): 2407-2412. |
| [51] |
YOUNG M D, MITCHELL T J, VIEIRA BRAGE F A, et al. Single-cell transcriptomes from human kidneys reveal the cellular identity of renal tumors[J]. Science, 2018, 361(6402): 594-599. DOI:10.1126/science.aat1699 |
| [52] |
ZEISEL A, MUÑOZ-MANCHADO A B, CODELUPPI S, et al. Cell types in the mouse cortex and hippocampus revealed by single-cell RNA-seq[J]. Science, 2015, 347(6226): 1138-1142. DOI:10.1126/science.aaa1934 |
| [53] |
HUBERT L, ARABIE P. Comparing partitions[J]. Journal of Classification, 1985, 2: 193-218. DOI:10.1007/BF01908075 |


