2. 中国动物卫生与流行病学中心,山东青岛 206032
2. Department of Epidemiology Survey, China Animal Health and Epidemiology Center, Qingdao, Shandong, 206032, China
Brucellosis, which occurs in more than 100 countries, is the most common zoonotic disease worldwide[1-2].Although the mortality of brucellosis is low, brucellosis remains a significant issue worldwide and substantially affects the economy and human health[3].Transmission of brucellosis between humans is rare.Individuals mainly obtain the disease from livestock, such as sheep, therefore, controlling human brucellosis requires the control of animal brucellosis[4].Contacts between locations during sheep movements determine the global spread of brucellosis.Sheep movements between locations can be considered a network in which the locations are represented as nodes and the movements are defined as edges or relationships.Therefore, the brucellosis transmission network occurs within the sheep-movement network[5], and data from the sheep-movement network are valuable for understanding the epidemiological characteristics of brucellosis.Thus, various sheep-movement networks contribute to the different risk levels for brucellosis outbreaks in different regions[6].
Because livestock movement data are valuable in the prevention and control of zoonotic diseases, many countries have established livestock movement databases or animal-trace-bank systems.A promising approach to analyzing livestock movement network data is social network analysis (SNA)[7].SNA has been used widely in human epidemiology as a tool to research infectious diseases such as SARS[8], AIDS[9-10] and tuberculosis[11], but it has only recently been applied in preventive veterinary care.Many countries, including England, Spain, Italy, Denmark, Sweden, and France, have applied SNA to the analysis of livestock movement data.Bigras-Poulin characterized the trade patterns of the Danish cattle and swine industries and evaluated the potential risk for disease spread with SNA[12-13].Using SNA techniques, Natale described the global structure of the Italian cattle industry and the relationships between locations relative to the potential implications of the transmission of cattle diseases[14].Rautureau proposed a method based on the analysis of specific subnetworks to assess network vulnerability in the spread of infectious diseases and to determine an efficient method for developing emergency control strategies[15].In general, SNA offers benefits for characterizing the pattern of livestock movements, exploring the risk of potential disease spread, analyzing the effects of livestock movement network structures in the spread of diseases and providing a method for identifying high-risk individuals or groups for the introduction or spread of zoonotic diseases in preventive veterinary medicine.
This paper describes the sheep-movement networks of various regions in Inner Mongolia of China.Several statistical network metrics were estimated, representing the network properties and vulnerability to the spread of brucellosis.The risk of brucellosis outbreak in different regions was then calculated based on related SNA indicators and the high-risk nodes and key points of brucellosis prevention in each network were also explored.
1 Materials and Methods 1.1 Profile of sheep Farming system in Xingan AllianceThe sheep farming system profile in the Xingan Alliance Inner Mongolia is one of several provinces in China with a particularly high incidence of brucellosis.This study was conducted in the Xingan Alliance of Inner Mongolia.The Xingan Alliance is located in the northeastern region of Inner Mongolia.With rich pasture resources (3 000 acres) and a large carrying capacity (6.4 million sheep), the Xingan Alliance is becoming a major livestock production base of Inner Mongolia and China.Recently, the incidence of brucellosis in humans in the Xingan Alliance has increased, in part because of an increase in the number of herdsmen.The total number of brucellosis patients from 2001 to 2009 was 5 420.Sick sheep are the main infectious source of animal and human brucellosis in the Xingan Alliance.
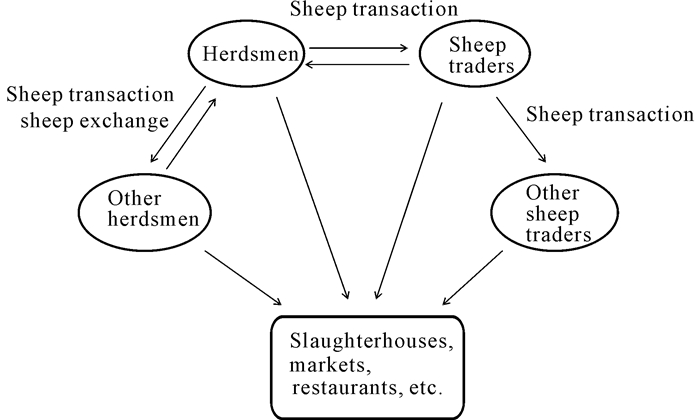
For the sheep-movement relationships between locations along the sheep production chain in the Xingan Alliance, see Fig. 1.The sheep flow between herdsmen is a retailer network, whereas the network between herdsmen and live sheep traders is wholesale.There are considerable variations in the sheep farming system, sheep-movement patterns and the risk of brucellosis outbreak in different regions of the Xingan Alliance.One of the study objectives was to compare the risk of brucellosis outbreak in different regions based on a sheep-movement network analysis.
|
Fig.1 The sheep-movement relationships between locations along the sheep production chain in the Xingan Alliance |
Expert-opinion elicitation panels were conducted in the initial stage of this study, including slaughterhouse managers and experts from animal health supervision agencies and from animal disease prevention and control agencies from the three regions of Inner Mongolia.The purpose of the informal discussion was to understand the history of the brucellosis epidemic, the related prevention and control strategies and the sheep flow pattern of Inner Mongolia.
A questionnaire was used as a survey tool in the second stage of the study.One hundred farms or herdsmen and 20 sheep traders completed the questionnaire, in each of the three regions of Inner Mongolia after stratified sampling.The following attributes for each premise were included in the questionnaire:the location type (farms, herdsmen or sheep traders) and a record of each sheep movement, including the date, number, origin and destination.
1.3 Network construction and analysisBased on the sheep-movement data we obtained from the questionnaire, we constructed sheep-movement matrices to construct directed sheep-movement networks of the three regions, in which each location was considered a node and each sheep movement represented an edge.Because a small number of sheep flowed into local consumption, we defined a node in each of the three networks to represent the local markets and restaurants.
The sheep-movement matrices were initially translated into maps of sheep-movement networks.For each network, the following network measures were calculated to investigate the network structure and vulnerability:density, the characteristic path length, diameter, centralization, clustering coefficient and components.For each node, the indegree, outdegree and betweenness were calculated to explore the influence of the node on the spread of brucellosis.The correlation between the indegree and outdegree was examined because a high correlation between these variables accelerates the spread of brucellosis.
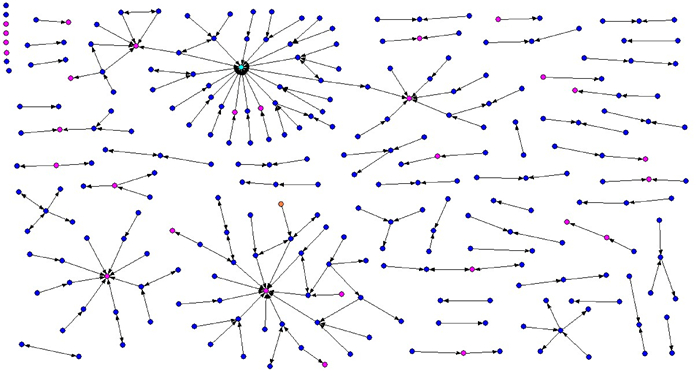
2 Results 2.1 Maps of the three sheep-movement networksFig. 2 shows that with three obvious hub nodes, the sheep-movement network of the agricultural region is reticular.Many nodes are scattered around the hub nodes and point inward.Additionally, the network map includes many small components of one to five nodes.The dark blue dots are prone to directly connecting to other dark blue dots, thus showing that the sheep transaction and exchange between farms is more frequent in this agricultural region.Generally, the sheep were moved several times before being dispatched to the slaughterhouse.
|
Dark blue dots represent farms, light blue dots represent slaughterhouses, red dots represent sheep traders, and orange dots represent markets or restaurants Fig.2 The sheep-movement network map for the agricultural region |
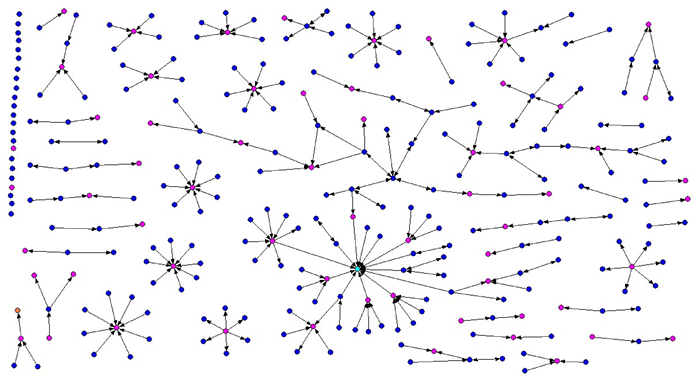
Fig. 3 shows the sheep-movement network of the pastoral region.This network consists of a huge cluster and several small components.More specifically, the network includes many "snowflake-like" structures with central red dots and surrounded by dark blue dots.Unlike the agricultural network, most of these dark blue dots connect to red dots rather than to other dark blue dots, thus demonstrating that in the pastoral region, there were few exchanges of sheep between herdsmen and few total sheep transactions.Most of the sheep were initially wholesaled to sheep traders and sent to market or to the slaughterhouse by the sheep traders.In this region, the sheep trader plays an intermediary role in the circulation of sheep.
|
Dark blue dots represent farms, light blue dots represent slaughterhouses, red dots represent sheep traders, and orange dots represent markets or restaurants Fig.3 The sheep-movement network map of the pastoral region |
Fig. 4 shows that the agricultural-pastoral network has the characteristics of both agricultural and pastoral region networks.This region had many "snowflake-like" structures with red dots at the center, and there were also many blue nodes connected into small chain-like components.The farms and the pastures were relatively isolated.The sheep-circulation mode of the agricultural-pastoral farms was similar to that of the agricultural region, whereas that of the herdsmen of agricultural-pastoral region was similar to that of the pastoral region.

|
Dark blue dots represent farms, light blue dots represent slaughterhouses, red dots represent sheep traders, and orange dots represent markets or restaurants Fig.4 The sheep-movement network map of the agricultural-pastoral region |
Table 1 shows that there is no difference in the average geodesic distance or diameter of the three networks.The agricultural network contained fewer nodes and directed links and the pastoral network contained more isolated nodes in the three networks.The average geodesic distances of the three sheep-movement networks are 3.851, 4.905, 3.457, and the longest distance between any two nodes in the three networks is less than five.
| Table 1 Descriptive statistics of network size |
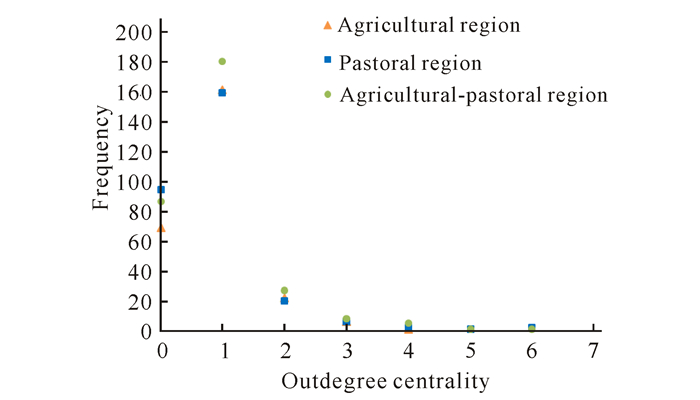
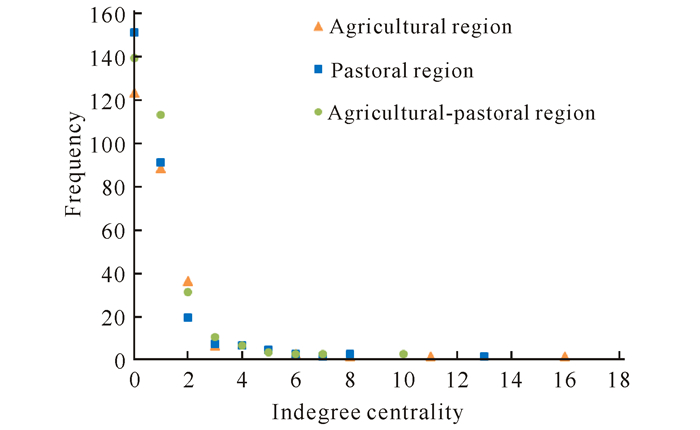
Fig. 5 and Fig. 6 show that the frequency distributions of the outdegrees and indegrees of the three networks were highly similar.Node degree, particularly the indegree, showed heterogeneity.Most outdegrees were 1, followed by 0, whereas most indegrees were 0, followed by 1.
|
Fig.5 The frequencies of different values of outdegree centrality |
|
Fig.6 The frequencies of different values of indegree centrality |
Table 2, shows that the densities of the three sheep-movement networks were not high, thus indicating that the networks were all sparse.The clustering coefficients of the agricultural and agricultural-pastoral networks were both higher than that of the pastoral network.Table 1 shows that the average geodesic distances of the agricultural and agricultural-pastoral networks were smaller than that of the pastoral network, thus demonstrating the small-world characteristics of the agricultural and agricultural-pastoral networks.There were no large differences in most of the components, the size of the largest component or the average size of the components of the three networks.
| Table 2 Descriptive statistics of network structure and vulnerability |
The nodes could be divided into four types based on the different degree of each node.The sending nodes exported sheep and were likely to spread brucellosis, whereas the receiving nodes imported sheep and were likely to be infected by brucellosis.The transfer nodes, which both export and import sheep, were undoubtedly high-risk nodes and are considered the main disseminators of brucellosis in the network.Table 3 summarizes the number and proportion of each node type.Table 3 shows that sending nodes formed the highest proportion of nodes in all three networks.The distributions of the different node types in the three networks were significantly different (χ2=14.930, P=0.021).Specifically, the difference between the agricultural and agricultural-pastoral networks was not statistically significant, but the difference between the pastoral network and each of the other networks was statistically significant.Compared with the other networks, the pastoral network showed a higher proportion of isolated nodes and a smaller proportion of transfer nodes.
| Table 3 The numbers of different types of nodes (proportion (%)) |
Betweenness centrality is mainly used to identify nodes that act as bridges in the network.Nodes with high betweenness nodes play an important role in the diffusion of brucellosis bacteria.Table 4 shows that the mean betweenness of nodes in the pastoral and agricultural-pastoral networks was high and the betweenness centralizations in both pastoral and agricultural-pastoral networks were higher than that of the agricultural network, thus showing strong centralization tendencies in the networks of both the pastoral and agricultural-pastoral regions.
| Table 4 Descriptive statistics of betweenness centrality |
Table 5 lists the ten nodes with the highest betweenness centrality in each of the three regional networks.The ten nodes with the highest betweenness centrality in the agricultural network were all farm nodes, whereas those in the pastoral and agricultural-pastoral networks contained some sheep-trader nodes.The descriptive statistics of network structure and vulnerability were recalculated using UCINET 6.0 after removing the ten nodes with the highest betweenness centrality in each of the three regional networks.The results are shown in table 6.(Lines with a white background show the initial values from table 2, and lines with a light gray background are the new values that were calculated after the removal of the nodes with the highest betweenness centrality nodes.)Apart from the clustering coefficient of the agricultural-pastoral network, there were distinct changes in the other measures after the removal of the nodes with the high betweenness centrality.There were significant decreases in the density of all three networks and in the clustering coefficients of the agricultural and pastoral networks.The total number of components in the three regional networks significantly increased, and the size of the largest component and average size of the components decreased.These changes indicate that the targeted removal of nodes based on betweenness centrality improved the properties of all three networks.Thus, the risk of brucellosis outbreak declined.
| Table 5 Ten of the highest betweenness centrality nodes of the three networks |
| Table 6 Descriptive statistics of network structure and vulnerability |
Animal movements, which transfer both infected and non-infected animals, are considered the primary cause of the introduction and spread of infectious diseases[16].Sheep-movement networks are extremely important for understanding the epidemic of brucellosis[17].The results presented in this paper demonstrate that the structure of the sheep-movement network plays an important role in the introduction or spread of brucellosis.The heterogeneity of the different sheep-movement networks leads to different epidemics of brucellosis in different regions.
Trading of live sheep is a major cause of the long-distance diffusion of brucellosis.The topology of the sheep-movement network influences the size and speed of brucellosis diffusion.The outcomes of our study confirmed that the sheep-movement networks for both the agricultural and agricultural-pastoral regions had small-world properties.This result was also reported in other studies of livestock networks[18-19].The presence of "hubs" and small-world properties accelerated the spread of brucellosis.The average distance between nodes in a sheep-movement network with small-world properties is small.That is, the sheep flow is much more frequent between herdsmen or farms in a sheep-movement network with small-world properties.
The sheep-movement network of the agricultural region categorized in this study was reticular, and the sheep flow chain contained many links.Before transfer to a slaughterhouse, the sheep were moved several times between farms or sheep traders.Many sheep in the agricultural region were consumed locally, producing a high risk of brucellosis outbreak.The sheep flow chain in the pastoral region had a stronger central tendency.Thus, the sheep traders acted in a transit role in nearly all of the sheep movements, and the herdsmen were relatively isolated.Most of the sheep were sold to sheep traders by herdsmen and then resold to other buyers by the sheep traders.Because few sheep in the pastoral region were exchanged between the local herdsmen, the risk of brucellosis outbreak in the pastoral region was relatively low.The sheep-movement network in the agricultural-pastoral region had characteristics of both the agricultural and pastoral networks.The results showed that the risk of brucellosis outbreak in the agricultural-pastoral region was high.Based on the respective characteristics of different sheep-movement networks, in the agricultural region, farms should be targeted in brucellosis prevention and control work.In the pastoral region, such work should emphasize the supervision and control of sheep traders, and in the agricultural-pastoral region, brucellosis control should focus on the management of farms/herdsmen and sheep traders.
The combination of social network analysis and animal movement data will better support brucellosis prevention and control work.One of the effective prevention measures against the introduction and spread of a new brucellosis infection in Inner Mongolia is sheep quarantine or movement restrictions based on the degree centrality.Highly connected nodes with high indegree and outdegree values were considered the super spreaders of brucellosis.These nodes were likely to become infected and to transmit brucellosis and should be emphasized in surveillance, prevention and control activities.The outcomes of our study confirm that the proportion of super-spreader-nodes in the pastoral region was smaller than in the other two regions, thus also reflecting the lower risk of brucellosis outbreak in the pastoral region.
However, the clustering subgroup and visual analyses for social network analysis technology based on sheep-movement records contributed to the estimation of the extent of the brucellosis epidemic and identified crucial nodes in the spread of brucellosis.With an outbreak of brucellosis, the capacity to rapidly identify the crucial, potential infection-spreading nodes is beneficial.Timely implementation of prevention measures for crucial high-risk nodes, such as restrictions on sheep movement may undoubtedly control the brucellosis epidemic.The targeted removal of nodes based on betweenness centrality improved the properties of all three networks, thus decreasing the risk of brucellosis outbreak.
The results reported in this paper represent the benefits of social network analysis technology for the prevention and control of brucellosis.Further research in this field should incorporate temporal dynamics and spatial dimensions into the sheep-movement network because patterns of sheep movement in different seasons may present different risks for brucellosis outbreaks.
Acknowledgements We thank the China Animal Health and Epidemiology Center for financial support.We thank Associate Research Fellow Xiangdong Sun from the China Animal Health and Epidemiology Center for his guidance in the study design, questionnaire design and data analysis.We also thank all subjects who participated in this study.| [1] | MEMISH Z A, BALKHY H H. Brucellosis and international travel[J]. J Travel Med, 2004, 11:49–55. DOI:10.2310/7060.2004.13551 |
| [2] | PAPPAS G, PAPADIMITRIOU P, AKRITIDIS N, et al. The new global map of human brucellosis[J]. Lancet Infect Dis, 2006, 6:91–99. DOI:10.1016/S1473-3099(06)70382-6 |
| [3] | CORBEL M J. Brucellosis:An overview[J]. Emerging Infecttous Diseases, 1997, 3(2):213–221. DOI:10.3201/eid0302.970219 |
| [4] | BOSCHIROLI M L, FOULONGNE V, O'CAL-LAGHAN D. Brucellosis:A worldwide zoonosis[J]. Curr Opin Microbiol, 2001, 4:58–64. DOI:10.1016/S1369-5274(00)00165-X |
| [5] | KISS I Z, GREEN D M, KAO R R. The network of sheep movements within Great Britain:Network properties and their implications for infectious disease spread[J]. Journal of the Royal Society Interface, 2006, 3:669–677. DOI:10.1098/rsif.2006.0129 |
| [6] | MARTNEZ-LÓPEZ B, PEREZ A M, SÁNCHEZ-VIZCAÍNO J M. Social network analysis.Review of general concepts and use in preventive veterinary medicine[J]. Transbound Emerg Dis, 2009, 56:109–120. DOI:10.1111/jva.2009.56.issue-4 |
| [7] | DUBÉ C, RIBBLE C, KELTON D, et al. A review of network analysis terminology and its application to foot-and-mouth disease modelling and policy development[J]. Transbound Emerg Dis, 2009, 56:73–85. DOI:10.1111/jva.2009.56.issue-3 |
| [8] | MEYERS L A, POURBOHLOUL B, NEWMAN M E J, et al. Network theory and SARS:Predicting outbreak diversity[J]. Journal of Theoretical Biology, 2005, 232:71–81. DOI:10.1016/j.jtbi.2004.07.026 |
| [9] | CHRISTLEY R M, PINCHBECK G L, BOWERS R G, et al. Infection in social networks:Using network analysis to identify high-risk individuals[J]. American.Journal of Epidemiology, 2005, 162:1024–1031. DOI:10.1093/aje/kwi308 |
| [10] | DE R, WYLIE J L, CAMERON D W, et al. Combining social network analysis and cluster analysis to identify sexual network types[J]. Int J STD AIDS, 2007, 18:754–759. DOI:10.1258/095646207782212234 |
| [11] | COOK V J, SUN S J, TAPIA J, et al. Transmission network analysis in tuberculosis contact investigations[J]. J Infect Dis, 2007, 196:1517–1527. DOI:10.1086/525005 |
| [12] | BIGRAS-POULIN M, THOMPSON R A, CHRIEL M, et al. Network analysis of Danish cattle industry trade patterns as an evaluation of risk potential for disease spread[J]. Preventive Veterinary Medicine, 2006, 76:11–39. DOI:10.1016/j.prevetmed.2006.04.004 |
| [13] | BIGRAS-POULIN M, BARFOD K, MORTENSEN S, et al. Relationship of trade patterns of the Danish swine industry animal movements network to potential disease spread[J]. Preventive Veterinary Medicine, 2007, 80:143–165. DOI:10.1016/j.prevetmed.2007.02.004 |
| [14] | NATALE F, GIOVANNINI A, SAVINI L, et al. Network analysis of Italian cattle trade patterns and evaluation of risks for potential disease spread[J]. Preventive Veterinary Medicine, 2009, 92:341–350. DOI:10.1016/j.prevetmed.2009.08.026 |
| [15] | RAUTUREAU S, DUFOUR B, DURAND B. Vulnerability of animal trade networks to the spread of infectious diseases:A methodological approach applied to evaluation and emergency control strategies in Cattle, France, 2005[J]. Transboundary and Emerging Diseases, 2011, 58:110–120. DOI:10.1111/jva.2011.58.issue-2 |
| [16] | ORTIZ-PELAEZA, PFEIFFER D U, SOARES-MAGALH ES R J, et al. Use of social network analysis to characterize the pattern of animal movements in the initial phases of the 2001 foot and mouth disease (FMD) epidemic in the UK[J]. Preventive Veterinary Medicine, 2006, 76:40–55. DOI:10.1016/j.prevetmed.2006.04.007 |
| [17] | KISS I Z, GREEN D M, KAO R R. The network of sheep movements within Great Britain:network properties and their implications for infectious disease spread[J]. Journal of the Royal Society Interface, 2006, 3(10):669–677. DOI:10.1098/rsif.2006.0129 |
| [18] | FIRESTONE S M, CHRISTLEY R M, WARDA M P, et al. Adding the spatial dimension to the social network analysis of an epidemic:Investigation of the 2007 outbreak of equine influenza in Australia[J]. Preventive Veterinary Medicine, 2012, 106(2):123–235. DOI:10.1016/j.prevetmed.2012.01.020 |
| [19] | SMITH R P, COOK A J C, CHRISTLEY R M. Descriptive and social network analysis of pig transport data recorded by quality assured pig farms in the UK[J]. Preventive Veterinary Medicine, 2013, 108(2/3):167–177. |
 2018, Vol. 25


